

Systemteori
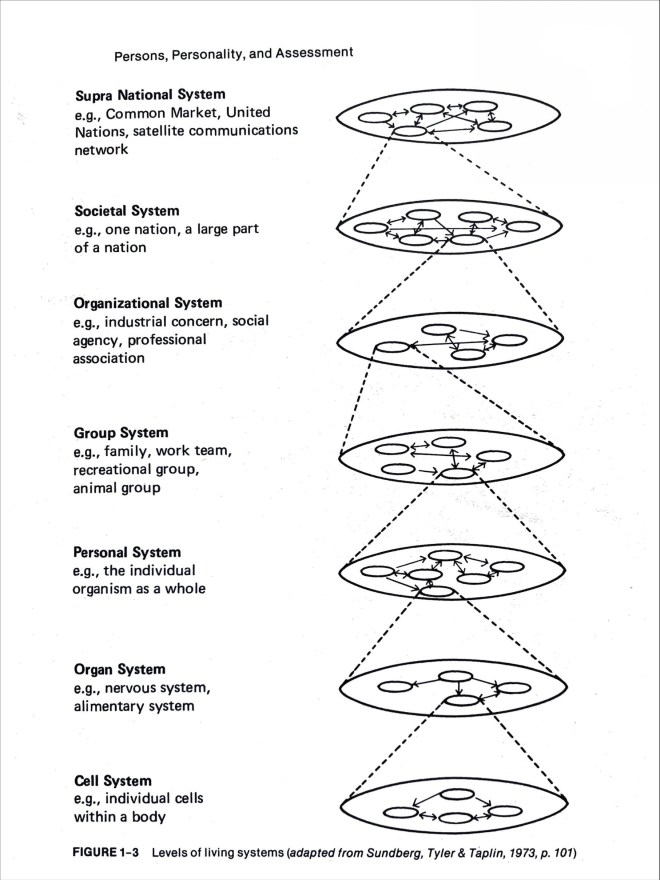
Nedanstående bild illusterar att människan är del av olika system. Den visar allt ifrån cellnivå nederst, till hur kroppens eget inre system fungerar, till det psykologiska, organisatoriska, sociologiska, samhällssystem osv. För att förstå varför en människa inte fungerar som den vill/ska behöver man inkludera så många system som det går.
Normalfördelningskurva (nedan)
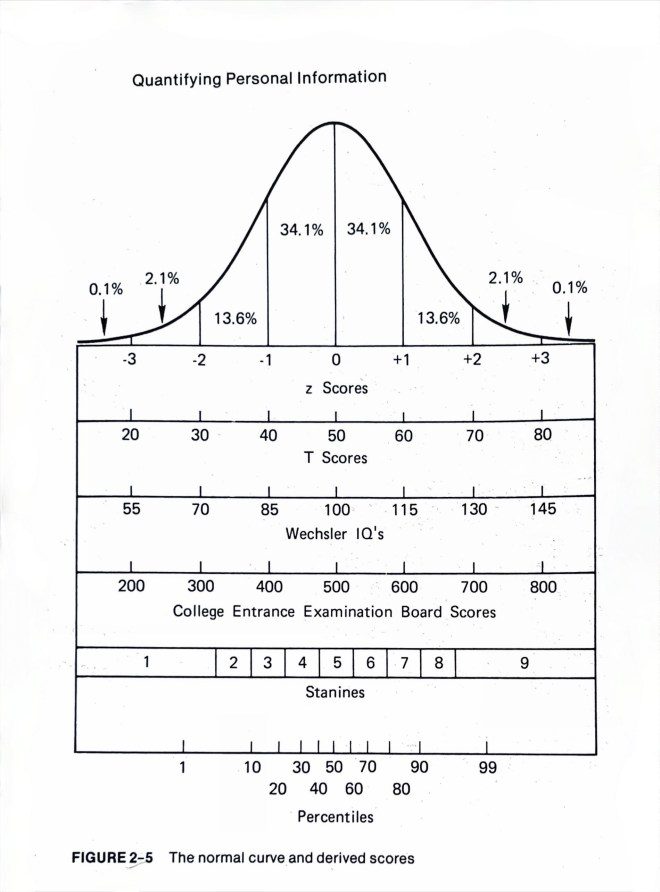
Mellan IQ (Intelligenskvot) 85 och 115 finns nästan 70% av västerländska befolkningar. Denna zon (egentligen två st) kallas normalzonen. Omkring IQ 70 och nedåt (ca 2% av befolkningen) brukar kräva insatser från samhället (intellektuellt funktionshinder), och över IQ 130 (också dryga 2%) är de människor som ofta har mycket lätt för sig på utbildningar och i arbete (om inte andra faktorer hindrar).
En grupp som ofta råkar illa ut i samhället är de som placerar sig mellan IQ 70 och 85. Inte tillräckligt nedsatta för att per automatik få samhällets insatser, men inte heller så resursstarka att det alltid är så lätt att ta sig igenom vare sig skola eller vuxenlivet sedan.
IQ mäts med härför speciellt framtagna tester (ca 14 st). Förutom att man mäter logisk-matematisk förmåga, går man igenom språk, rumsligt seende, snabbhet, arbetsminne mm. Det är ett sammansatt batteri som är beforskat, godkänt och brukas i hela västvärlden.
(Övriga siffror i bilden visar samma sak, men bara i andra skalor. I mina utlåtanden brukar jag använda z-skalorna.)
I min mottagning är det sällan hela IQ jag är ute efter, utan hur klienten/patienten presterar på de olika deltesten. Härigenom kan jag få information om hur de olika delarna av hjärnan fungerar, vilket utgör grunden för hur eventuell kompensation skall läggas upp.
Systems theory
The first image (please scroll up a bit) illustrates that humans are part of multiple systems. Covering everything from the cellular level at the bottom of the image, to how the body’s own internal system works, to the psychological, organizational, sociological, social systems, etc. This becomes essential in understanding why a person is functioning below the desired level.
Normal Distribution
The second image (scroll up) shows the curve of normal distribution.
Almost 70% of Western populations score between IQs (Intelligence Quotient) 85 and 115. This zone (actually two zones) is called the normal zone.
Persons who score around IQ 70 and below usually require some interventions from society (intellectual disability), and those above IQ 130 are the people who often find education and work rather easy undertakings (unless other factors interfere).
A group that often ends up less fortunate in society are those who score between IQs of 70 and 85. Not impaired enough to automatically receive society’s interventions/programs, yet neither resourceful enough to easily make their way through school and adulthood.
IQ is measured with specifically designed tests (approx. 14). Not only logical-mathematical ability is measured, but also language, spatial perception, processing speed, working memory, etc. It is a compound battery that is thoroughly researched, approved, and used throughout the western world.
(The other figures in the image show the same thing, but only on different scales. In my reports I usually use the z-scores, the top figures in the picture.)
In my practice, I rarely look for the total IQ score, but instead how the client/patient performs on the various subtests. Through this, I can get information about how the different parts of the brain work, which in turn makes a foundation for how I might help with compensatory strategies.
